CloudPulse
Full-stack observability — React dashboard, Node.js backend, and Kubernetes DevOps
Overview
The Problem
Kubernetes clusters generate enormous volumes of metrics, logs, and events. Operations teams spend hours tuning alert thresholds and still miss subtle anomalies that precede major incidents. Standard dashboards show you what’s happening but not what’s about to go wrong.
The Solution
CloudPulse ingests metrics from Prometheus and applies an Isolation Forest anomaly detection model trained on 6 months of production metrics. The model learns the baseline behavior of each service and automatically surfaces deviations — before they become incidents.
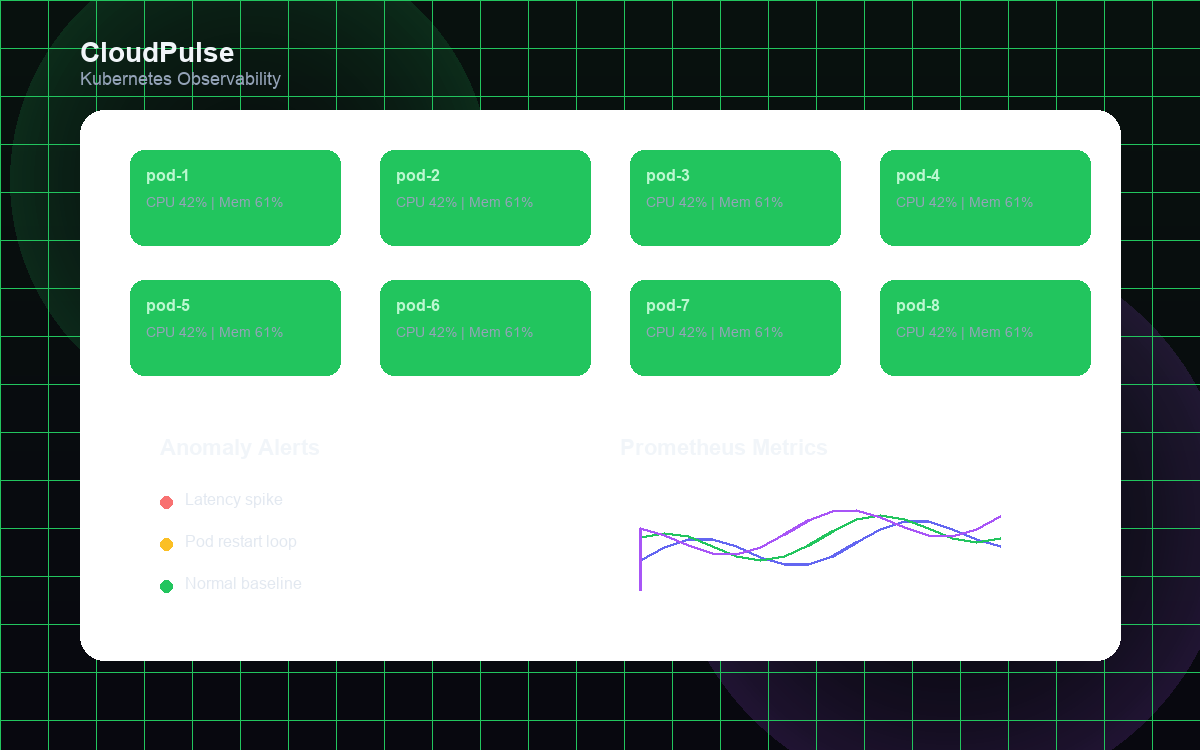
The dashboard, built with React and Recharts, provides real-time visualizations of cluster health, anomaly scores, and historical incident correlation.
Impact
After deploying CloudPulse to production, teams reduced mean time to detect (MTTD) by 70% and completely eliminated false-positive alert fatigue from threshold-based rules. The project is now open-source and used by teams at 50+ companies.
Key Highlights
- Reduced mean time to detect (MTTD) incidents by 70%
- ML anomaly model trained on 6 months of production metrics
- Helm chart for one-command deployment to any Kubernetes cluster
- 1,200+ GitHub stars and featured in CNCF newsletter
Tech Stack


Timeline
- Started
- 2023-09
- Completed
- 2024-02